Data Dictionaries
Documentation for Advan's mobility and transaction data products. Use the sidebar to navigate between products and sections.
Weekly Patterns+ v2.8
Weekly Patterns+ data provides the same foot traffic data insights as Monthly Patterns+ on a weekly basis, tracking data from Monday to the end of day on Sunday each week.
Weekly Patterns+ are available starting from January 1st, 2018. Data is delivered three days after the week ends (on Wednesday), providing more frequent actionable data.
Note: Weekly Patterns+ includes both US and Canada foot traffic data.
Schema
| Column Name | Description | Type | Example |
|---|---|---|---|
| id_store | Unique ID tied to this point of interest ("POI"). This ID is guaranteed to be persistent across the lifespan of the company, excluding M&A events. See persistent_id_store for M&A handling. |
Integer | 6255608 |
| ticker | The exchange-traded ticker, if available, or a custom ticker for private companies and subsidiaries. | String | COST |
| persistent_id | Unique, human-readable identifier guaranteed to be persistent even across M&A events that represents this specific company. | String | A1_UPS |
| persistent_id_store | Persistent ID tied to this POI. Guaranteed to be persistent across the lifespan of the location, including M&A events. | Integer | 6255608 |
| footprint_id | Unique identifier for the physical polygon of the store location. | Integer | 1234567891234567891 |
| is_distributor | Whether this is a company owned location (null) or a distribution location for the company's products (1). | Integer | null |
| location_name | The name of the point of interest. | String | Salinas Valley Ford Lincoln |
| street_address | Street address of the point of interest. | String | 1100 Auto Center Circle |
| city | The city of the point of interest. | String | Irvine |
| region | The state, province or county of the point of interest. | String | CA |
| postal_code | The postal code of the place of interest. | String | 92602 |
| iso_country_code | The 2 letter ISO 3166-1 alpha-2 country code. | String | US |
| brand | Company DBA ("doing business as") name if explicitly identified. | String | UPS |
| open_date | The date the store location opened. 1970-01-01 denotes locations opened before 1/1/2010. | YYYY-MM-DD | 1970-01-01 |
| close_date | The date the store location closed. 2038-01-01 denotes locations that are still open. | YYYY-MM-DD | 2038-01-01 |
| longitude / latitude | Geographic coordinates for POI's location. | Float | -112.4556 / 38.3441 |
| naics_code | North American Industry Classification System Code. | String | 722511 |
| top_category | 4 digit NAICS description. | String | Restaurants and Other Eating Places |
| sub_category | 6 digit NAICS description. | String | Full-Service Restaurants |
| poi_cbg | The census block group (U.S.) or dissemination area (Canada) the POI is located within. | String | 560610112022 |
| msa_code | 5-digit Metropolitan Statistical Area. | String | 22300 |
| date_range_start | Start time for measurement period in ISO 8601 format (local time). The start time will be 12 a.m. Monday in local time. | String | 2020-03-02T00:00:00-06:00 |
| date_range_end | End time for measurement period in ISO 8601 format. The end time will be the following Monday at 12 a.m. local time. | String | 2020-03-09T00:00:00-06:00 |
| visit_counts | Number of estimated visits (sum of each day's unique visitors across all days in the date range) to this POI. | Integer | 1542 |
| visitor_counts | Number of unique estimated visitors to this POI during the date range. | Integer | 1221 |
| visits_by_day | The number of estimated visits to the POI each day (local time), Monday through Sunday. | JSON [Integer] | [33, 22, 33, 22, 33, 22, 22] |
| visits_by_each_hour | The number of estimated visits to the POI for each of the 168 hours of the week, starting at midnight on date_range_start. | JSON [Integer] | [33, 22, 33, 22, 33, 22, 22, 21, 23...] |
| visitor_home_cbgsTrade Area | Estimated visitors from each census block group (U.S.) or dissemination area (Canada) based on home location. | JSON {String: Int} | {"360610112021": 603} |
| visitor_home_aggregationTrade Area | Estimated visitors from each census tract (U.S.) or aggregate dissemination area (Canada) based on home location. | JSON {String: Int} | {"17031440300": 1005} |
| visitor_daytime_cbgsTrade Area | Estimated visitors based on primary daytime location on weekdays (M-F) between 8am-6pm. | JSON {String: Int} | {"360610112030": 9872} |
| visitor_country_of_origin | Estimated visitors from each country based on visitor's home country code. | JSON {String: Int} | {"US": 98, "CA": 12} |
| distance_from_home | Median distance from home travelled by visitors (of visitors whose home we have identified) in meters. | Integer | 1211 |
| median_dwell | Median minimum dwell time in minutes. | Double | 5 |
| bucketed_dwell_times | Distribution of visit dwell times by pre-specified buckets (key is range in minutes, value is estimated visits). | JSON {String: Int} | {"<5": 40, "5-20": 22} |
| related_same_day_brand | Other brands visitors went to on the same day as the visit to this POI. Top 20. | JSON {String: Int} | {"mcdonalds": 7} |
| related_same_week_brand | Other brands visitors went to in the same week as the visit to this POI. Top 20. | JSON {String: Int} | {"target": 3} |
| device_type | Estimated visitors using Android vs. iOS. | JSON {String: Int} | {"android": 6, "ios": 8} |
| carrier_namePremium | Estimated visitors by wireless carrier of the device. | JSON {String: Int} | {"Verizon": 342, "T-Mobile": 288} |
| Reserved1-5 | Reserved for backwards compatibility with legacy feeds. Currently set to NULL. | Float | NULL |
We do not report data if less than 2 visitors are observed from that group. If there are between 2 and 4 visitors, this is reported as 4. These numbers are before scaling to estimated visitors; the equivalent number of estimated visitors will be higher.
For trade area computations we utilize additional panels, which may in some cases result in total sum of visitors by CBG to be higher than visitor_counts.
SUCCESS and HISTORY RESTATED Flags
The following empty files are placed in the bucket(s) periodically:
_SUCCESS_PPLUS_WEEKLY_YYYYMMDD: placed in the associated GCS or AWS bucket as soon as all the weekly files are ready._HISTORY_RESTATED_PPLUS_WEEKLY_YYYYMMDD: placed in the associated GCS or AWS bucket whenever the historical data is restated, signaling the restatement is complete and ready to be loaded.
Key Concepts
Visit Attribution
We compute visits/visitors inside a POI using the POI's geometry. We do not apply any dwell time or any concept of "stops"; we rely on the polygon for accuracy. Testing on 1,500 publicly traded tickers versus top line revenue and credit card transaction counts has shown that filtering for dwell time reduces the signal and makes the correlation/forecasting worse.
Determining Home Location
We compute a device's home/work (night/day) location by computing the time a device spent in each building in the country; then taking the most frequented building.
Understanding Visitation and Trade Area Panels
For visitations we use a panel which is consistent across time and can be normalized, in order to generate accurate year-over-year growth metrics. For trade areas (visitor_home_cbgs, visitor_home_aggregation, visitor_daytime_cbgs, visitor_country_of_origin) we use all the panels we are receiving, for which we have explicit permission to utilize for trade areas. This is a much larger panel, which intersects but does not fully contain the visitation panel, but it is more volatile week-over-week so therefore it should not be used for year-over-year comparisons. Advan recommends that users interpret these trade area values as ratios or scaled indicators rather than absolute numbers.
Backfills
Backfill is when we take our most recent locations (addresses + geofences) and run our visit attribution algorithm backward in time to generate a new history of "backfilled" Patterns+. Backfills are typically generated every time new Advan POIs are added (typically monthly, with the exception of August and December).
Weekly vs Monthly Patterns+ Differences
- Each delivery covers one week (Monday to Sunday), available three days later on Wednesday.
- Includes
visits_by_each_hourcolumn for 168-hour detailed view of the week. - Does not include
popularity_by_hourorpopularity_by_day(covered byvisits_by_each_hour). - Includes Canada foot traffic data (Monthly Patterns+ is US only).
- Uses
related_same_week_brandinstead ofrelated_same_month_brand.
Column Name Details
street_address
Title-cased, consistent, and friendly for human reading. We implement multiple steps to clean, validate and standardize addresses.
region
- US (
iso_country_code == US): state or territory - CA (
iso_country_code == CA): Canadian Province or territory - GB (
iso_country_code == GB): United Kingdom county
postal_code
- US: 5 digit zip code
- CA: 3 digit Forward Sortation Area (FSA) + space + 3 digit Local Delivery Unit (LDU)
- GB: British postal code
visits_by_day
Array of visits on each day in the week, Monday through Sunday. Days are broken up based on local time.
visits_by_each_hour
Array of visits for each hour that exists in the week (168 hours). The metric reflects the total duration of a visit, meaning the same device may be counted in multiple hours if the visit spans across them. Days are broken up based on local time.
visitor_home_cbgs
Home census block groups (U.S.) or dissemination areas (Canada) of the visitors. For each area, we show the number of associated visitors (not visits). If visits by home CBG is desired, multiply visitors from each CBG by the average visits/visitor (visit_counts / visitor_counts).
distance_from_home
Median haversine distance between the visitor's home geohash-7 and the POI location for each visit. If fewer than 5 visitors, the value will be null. Each visitor is counted equally (not adjusted for visits).
median_dwell
Median of the minimum dwell times calculated for each visit. Minimum dwell is determined by looking at the first and last ping from a device during a visit. It is possible to have a minimum dwell of 0 if we only saw 1 ping and determined the visit based on factors such as wifi.
bucketed_dwell_times
Bins: { "<5", "5-10", "11-20", "21-60", "61-120", "121-240", ">240" } (in minutes)
related_same_day_brand / related_same_week_brand
Brands that visitors also visited on the same day/week. The value is a simple percent of POI visitors that visited the other brand. Only the first 20 brands are returned.
Neighborhood Patterns+ v1.8
Footfall data aggregated by census block group (CBG) in the U.S. and dissemination area (DA) in Canada. Ideal for site-selection use cases and understanding area activity patterns.
Normalizes observed data to estimate actual counts across the adult population. Available starting from January 1st, 2019.
Schema
| Column Name | Description | Type | Example |
|---|---|---|---|
| area | The designation of the area. Canadian DAs have a "CA:" prefix. | String | 131000000000 |
| area_type | The type of area (Census Block Group for both US and CA). | String | Census Block Group |
| date_range_start / end | Measurement period in ISO 8601 format (local time). | String | 2020-03-01T00:00:00-06:00 |
| day_counts | Frequency of each day of the week in the date range. | JSON {String: Int} | {"Monday": 4} |
| stop_counts | Estimated stops of the adult population (min 1 minute duration). | Integer | 428840 |
| device_counts | Unique devices in the adult population that stopped in this area. | Integer | 109161 |
| stops_by_day | Number of stops each day over the covered time period. | JSON [Integer] | [33, 22, 33...] |
| device_home_areasPrivacy Applied | Devices that stopped in this area by home origin area. | JSON {String: Int} | {"360610112021": 603} |
| weekday_device_home_areasPrivacy Applied | Devices that stopped Monday through Friday. | JSON {String: Int} | {"130890212162": 91} |
| weekend_device_home_areasPrivacy Applied | Devices that stopped Saturday or Sunday. | JSON {String: Int} | {"130890212162": 91} |
| breakfast_device_home_areasPrivacy Applied | Devices that stopped 6am - 10:59am. | JSON {String: Int} | {"130890212162": 91} |
| lunch_device_home_areasPrivacy Applied | Devices that stopped 11am - 2:59pm. | JSON {String: Int} | {"130890212162": 91} |
| dinner_device_home_areasPrivacy Applied | Devices that stopped 5pm - 8:59pm. | JSON {String: Int} | {"130890212162": 91} |
| nightlife_device_home_areasPrivacy Applied | Devices that stopped 9pm - midnight. | JSON {String: Int} | {"130890212162": 91} |
| work_behavior_device_home_areasPrivacy Applied | Work hours devices that dwelled 6+ hours (excludes home visits). | JSON {String: Int} | {"130890212162": 42} |
| distance_from_home | Median distance from home in meters. | Integer | 29385 |
| median_dwell | Median dwell time in minutes (min 1 minute stops only). | Double | 5 |
| top_same_day_brand | Brands visited same day (top 20, percentage values). | JSON {String: Int} | {"mcdonalds": 7} |
| popularity_by_hour_[day]Privacy Applied | 24-element array of stops for each hour on that day of week. | Array | [9877, 8233...] |
| device_typePrivacy Applied | Devices using Android vs. iOS. | JSON {String: Int} | {"android": 6, "ios": 8} |
| region | US state/territory or Canadian Province/territory. | String | MD |
| y / m | Year and month of measurement period (for easier filtering). | Integer | 2021 / 6 |
A random number (0-5 in US, 0-3 in Canada) is added/subtracted before adjusting to adult population. Single-device areas are not reported; 2-4 devices are reported as 4. Starting January 2023 (US), only 65th percentile of areas are included.
Optional: Panel Overview Data
Key Concepts
Visit Attribution
Uses POI geometry without dwell time filtering. Tested against 1,500 publicly traded tickers and credit card transaction counts.
Determining Home Location
Computed by analyzing time spent in each building and selecting the most frequented.
SpendView v1.1
Credit and debit card transaction data sourced from over 120 million cards, representing an active user panel of about 40 million users (15% of the US population).
Validated Against Ground Truth
Our spend data closely tracks published company revenue, as demonstrated in Figure 1 below comparing Advan SpendView data against Chipotle's reported financials.
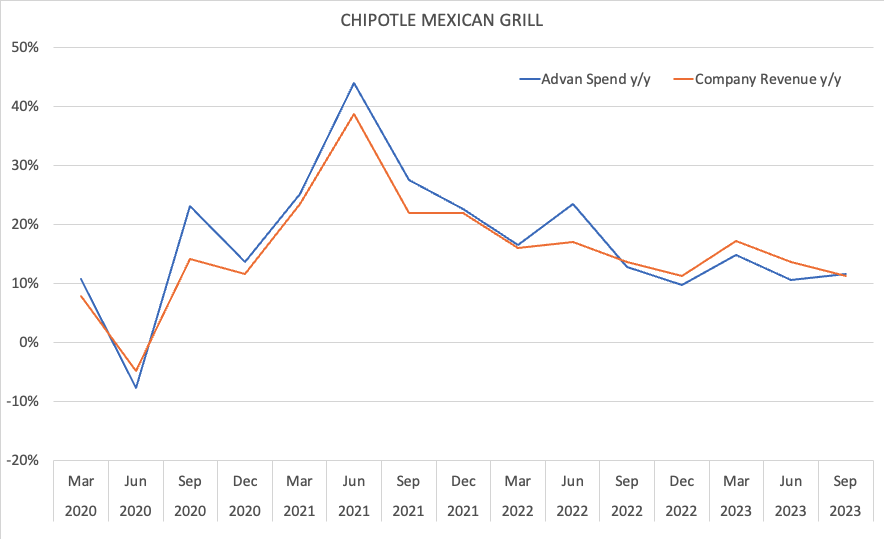
Figure 1: Advan Chipotle Spend vs Chipotle published Revenue on a year-over-year basis. The strong correlation demonstrates the accuracy and reliability of SpendView data.
5,000+ Brands
Large coverage, growing monthly.
Online & Brick-and-Mortar
Differentiates transaction channels.
Stable Panel
Largest available, consistent over time.
7+ Years History
From 1/1/2019, including pre-Covid.
Data by Brand, Period, and Customer Home Area
| Field | Description | Type | Example |
|---|---|---|---|
| period_type | D (daily), W (weekly), M (monthly), Q (quarterly), Y (yearly), YTD, TTM. | String | M |
| start_dt / end_dt | Period dates in YYYY-MM-DD format. end_dt is day after last day. | String | 2024-11-01 |
| brand_name | The name of the brand. | String | WEGMANS |
| area name | Customer residence area: zip, DMA, division, region, city, county, MSA, state_code. | String | 92341 |
| channel | A (ALL), O (ONLINE), or B (Brick and Mortar). | String | ALL |
| spend | Estimated amount spent. | Float | $5,057,959.34 |
| trans_count | Estimated number of transactions ("card swipes"). | Integer | 74,749 |
| customers | Estimated number of customers. | Integer | 65,684 |
| spend_N / trans_count_N | Spend/transactions by basket size. N: 6, 10, 14, 16, 25, 50, 75, 100, 150, 200, 250, 500, 1000, 10000. | Float / Int | $53,335.67 |
Data removed for privacy if fewer than 5 actual cards used. Use data aggregated to your desired level.
Data by SectorSeparate License
Sector data by NAICS and SIC codes. Same structure as brand data with sector_type and sector fields instead of brand_name.
Ranking DataSeparate License
Ranking of brands within sectors by spend, transactions, customers, basket size, and frequency.
| Field | Description | Type |
|---|---|---|
| spend | Ranking of amount spent (1 = highest) | Integer |
| trans_count | Ranking of transaction count | Integer |
| customers | Ranking of customer count | Integer |
| avg_basket | Ranking of average basket size | Integer |
| frequency | Ranking of spend frequency in period | Integer |
| sector_cnt | Number of brands in this sector | Integer |
Production Data Delivery
Files produced weekly (Wednesdays) and deposited in AWS:
s3://advan-spendview-brand-customer-period-us-east1/
s3://advan-spendview-sector-customer-period-us-east1/
s3://advan-spendview-rank-customer-period-us-east1/
_SUCCESS_WEEKLY_YYYYMMDD file indicates all period files are ready.